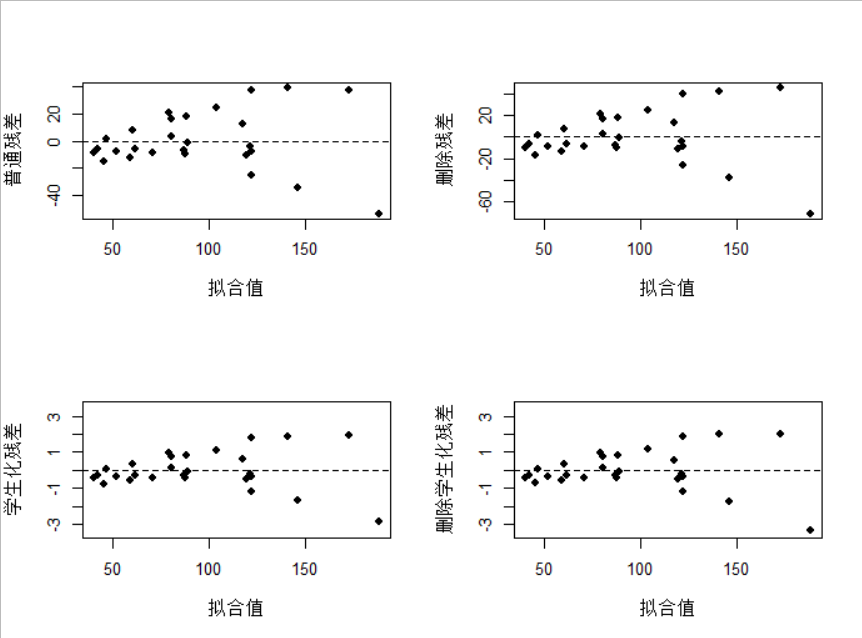
残差图诊断
par(mfrow = c(2,2))
# 普通残差图
plot(fitted(model), residuals(model), xlab="拟合值", ylab="普通残差",pch=19)
abline(h=0, lty=2)
# 删除残差图
plot(fitted(model), residuals(model)/(1-hatvalues(model)), xlab="拟合值", ylab="删除残差", pch=19)
abline(h=0,lty=2)
# 学生化残差图
plot(fitted(model), rstandard(model), xlab="拟合值", ylab="学生化残差", ylim=c(-3.5,3.5), pch=19)
abline(h=0, lty=2)
# 删除学生化残差图
plot(fitted(model), rstudent(model), xlab="拟合值", ylab="删除学生化残差", ylim=c(-3.5,3.5), pch=19)
abline(h=0, lty=2)
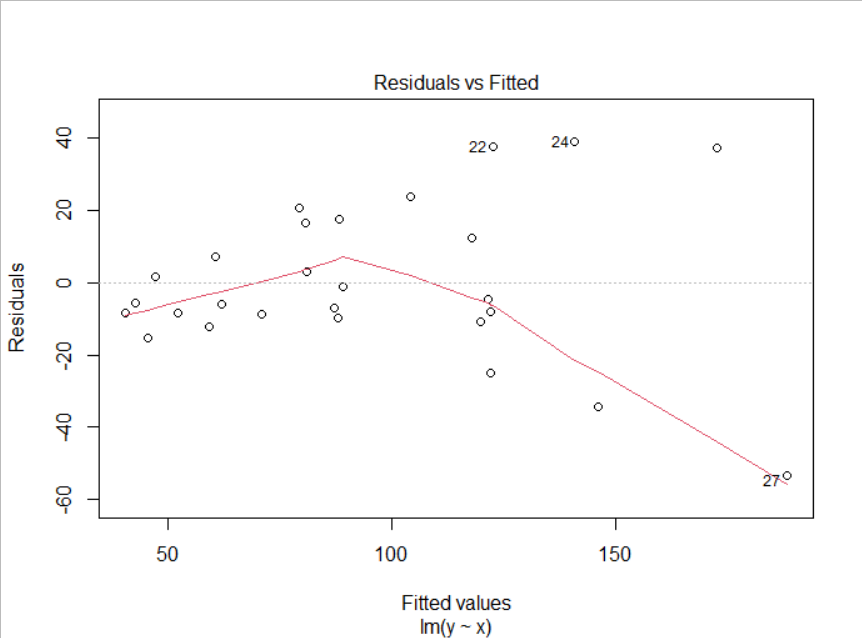
使用Plot做回归诊断图
有无非线性关系
plot(model,which=1)
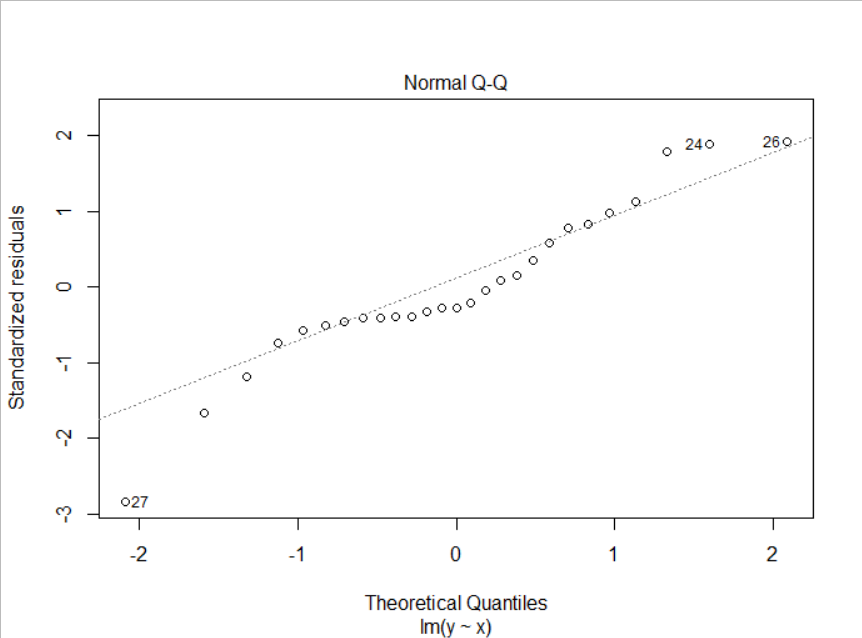
残差是否正态分布
plot(model, which=2)
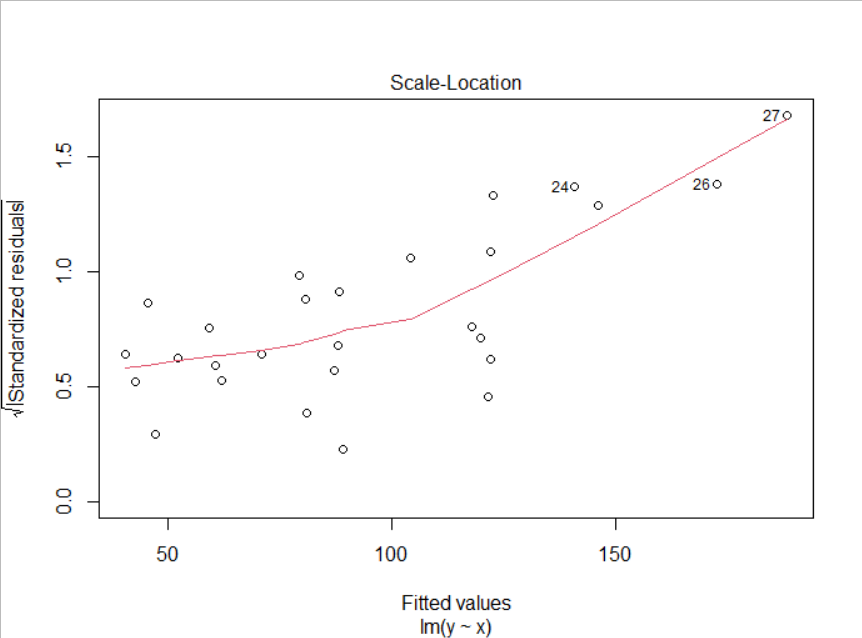
是否有异方差
plot(model, which=3)
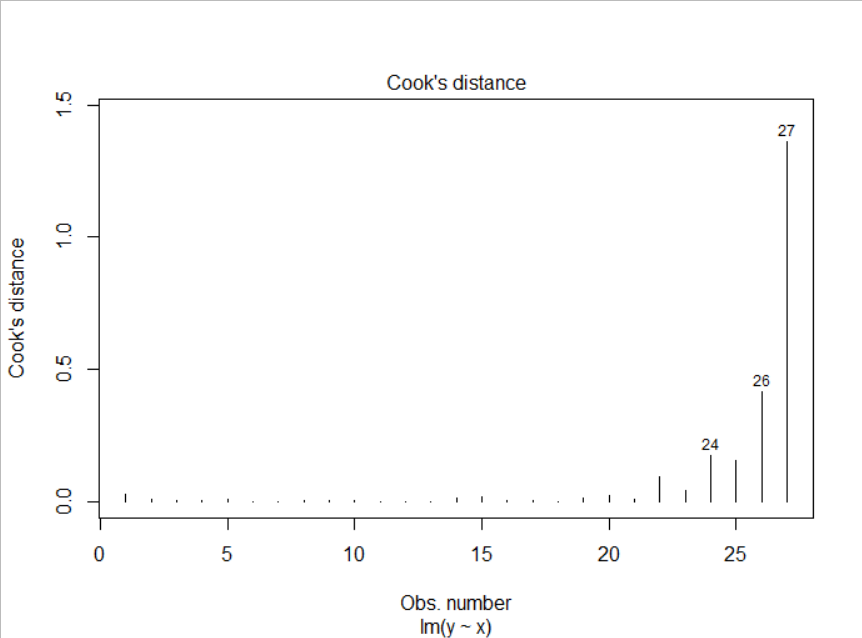
查看强影响点
plot(model, which=4)